In our economic analysis of changes that are taking place in Ukraine since 2013, we need to pay special attention to the consequences of Ukraine’s free trade agreement with the EU. In this article we test the assumptions about economic threats to our country’s development, related to the unequal nature of the abovementioned agreement. We analyse which trends in Ukraine’s economy were directly or indirectly caused by the change of the main vector of economic cooperation between Ukraine and the EU. We define which industries have suffered the greatest losses and which (if any) have gained. We show what is happening to the dynamics of foreign investment and whether the expectations for its growth have been met. We analyze the impact of restrictions (quotas) on the prospects of Ukrainian exports to the EU under the Free Trade Agreement. Based on this analysis, we summarise the economic consequences of the European Association and alternative directions of foreign economic activity.
General dynamics of foreign economic activity
Since early 2014 Ukrainian government gave up on its principle of “multivectorness” and has been increasing collaboration efforts with Western partners, while relations with the Commonwealth of Independent States (CIS), and in particular Russia have been deteriorating. It is worth noting, that the aggravation itself is largely due to the Association Agreement with the EU, which did not provide for the preservation of preferential trade under the CIS Agreement, which had been in effect for Ukraine since 2012. These factors affected Ukraine's foreign economic activity. The dynamics of the total trade turnover of goods and services is shown in Fig. 1.
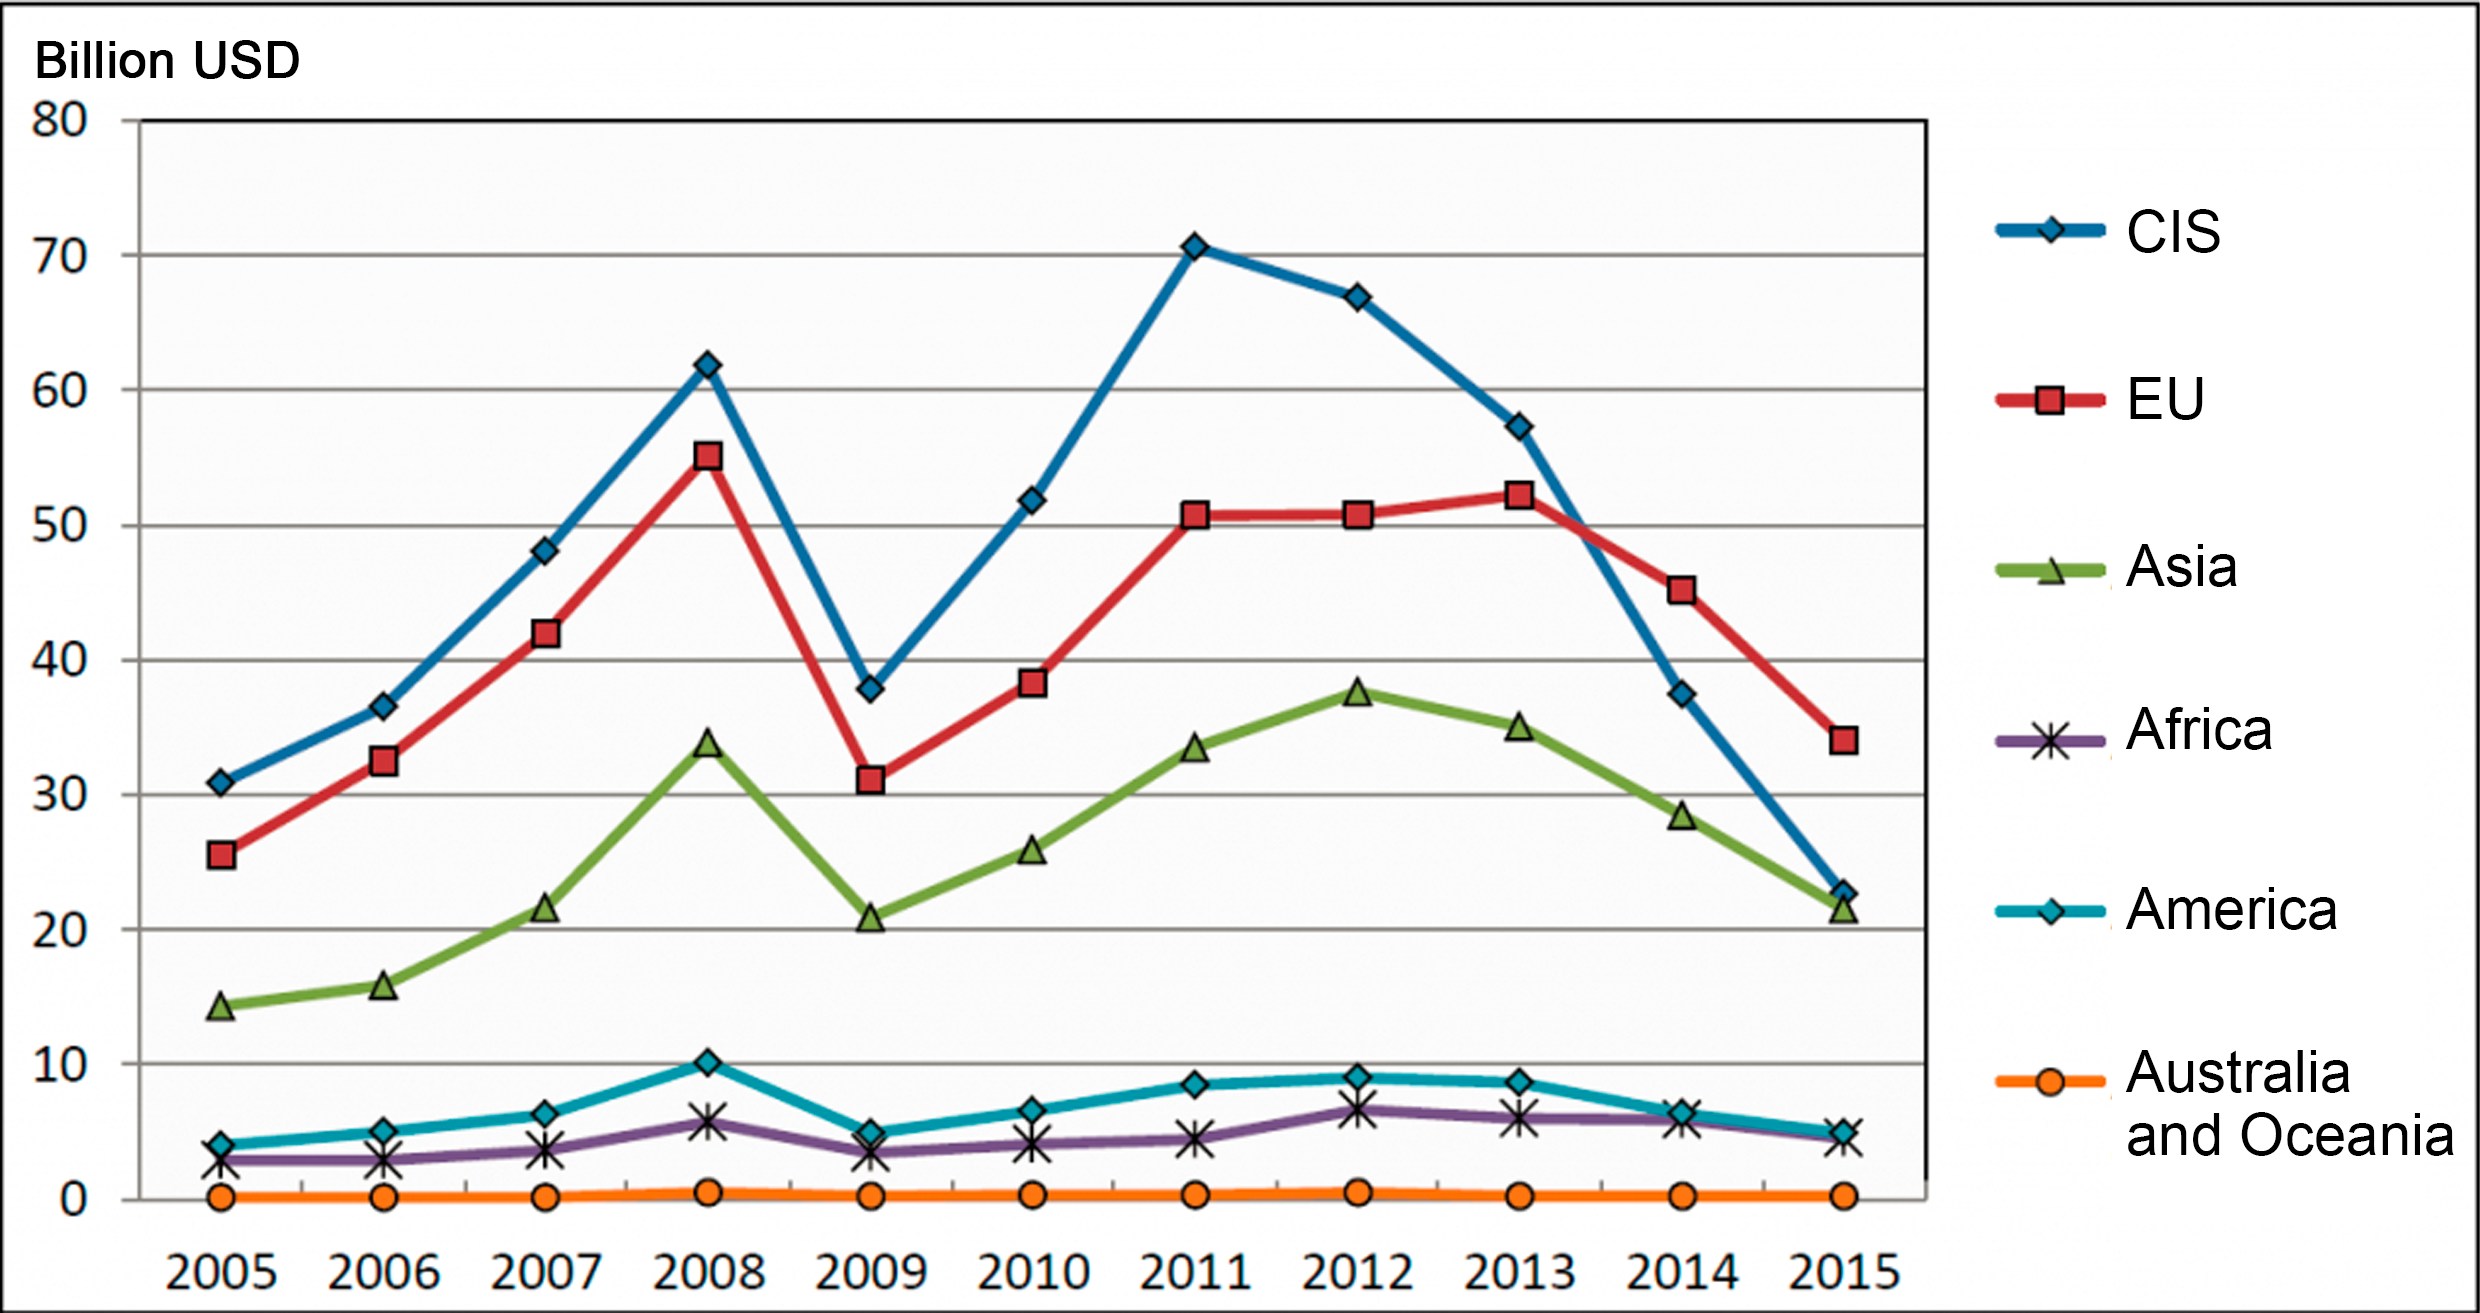
Figure 1. Dynamics of the total trade turnover (import and export) of goods and services with regions of the world in 2005-2015
Source: compiled by the author based on the data of the State Statistics Service of Ukraine
As we can see from this Figure, CIS and EU indeed were the two most important trade regions for Ukraine. Until the crisis of 2008, trade with them both was increasing at a similar pace, but after 2009 the collaboration with CIS dominated. Both export and import of goods, and export of services to this region increased at a higher rate than to the EU.
At the time of the Ukraine-EU Association Agreement, however, trade with the EU and the CIS was almost equalized. Already in 2013 aggravation of economic relations with Russia became evident. Russia could be seen as preventively protecting its own market from external competitors, as well as putting pressure on Ukraine regarding its EU Association Agreement. By 2015, trade collaboration with the CIS decreased so dramatically that it ended up at the same position with the Asian region (22.7 billion US dollars in 2015).
In our opinion, this decline is not to be seen as a victorious reduction in dependence on trade with Russia (Russia accounted for 68% of Ukraine's trade turnover with the CIS in 2013), as presented by the central Ukrainian media. After all, given the backwardness of the Ukrainian economy, to rejoice at the closure of trade channels for the remaining high-tech products means to support Ukraine's accelerated slide to the global periphery and the loss of chances to accumulate resources for development.
Ukraine's trade with all other regions of the world is also declining, although not at the same pace as trade with the CIS. This means that producers have generally failed to reorient themselves to other markets (including Asian ones) and are losing out in the competition. It should be noted that trade volumes in 2014-2015 in Fig. 1 are presented after deducting the statistics of enterprises located in the occupied Crimea and in the war zone in Eastern Ukraine, and thus the indicators show a deterioration of the situation even without taking into account the lost enterprises. This is the perspective that should be taken when assessing Ukraine's possible economic development in the near future.
Let us try to assess in more detail the economic consequences of the choice that Ukraine was faced with at the turn of 2013-2014.
Trade in goods
Trade in goods still accounts for the largest share in Ukraine's trade – 79.7%. This almost corresponds to the global average of 78%. However, developed countries are increasing their share of trade in services at a faster pace. Thus, countries of the global periphery are consolidating their role as suppliers of material products, while metropolitan countries are creating more and more liquid services.
Let's look at the dynamics of trade in goods with two regions – the CIS and the EU – which traditionally accounted for more than two-thirds of Ukraine's trade until 2014 (Figure 2).

Figure 2. Dynamics of trade in goods with the CIS and the EU in 2005-2015
Source: compiled by the author based on the data of the State Statistics Service of Ukraine
As the Figure shows, over the past two years, trade in goods with both regions has been declining. Since the beginning of 2013 we observe the decline in exports and imports with the CIS countries, in particular with Russia. In 2015, Ukraine's exports to the EU were just 9.7% lower than in 2013 (the year before “Euro-integration”), while trade with the CIS countries has seen a catastrophic loss of markets: their volume in monetary terms decreased by almost three times. In 2013, Ukraine received $20.7 billion in revenue from trade with this region, while in 2015 it received only $7.7 billion.
We see no significant positive changes in the official statistics for the first half of 2016. Although exports to the EU grew by 6.7% during this time, the total volume of Ukrainian goods exported abroad continues to fall compared to the same period in 2015 (-11.5%, to USD 13.7 billion). This was mainly due to a further decline in exports to the CIS countries (down by another third) and Asian countries (-14.6%).
The impact of the duty-free regime on imports of European products is insignificant – we see an increase of only 2.2% in January-June 2016. A much more significant factor is the decline in demand in Ukraine for imported products from abroad due to the fall in the solvency of the Ukrainian population and businesses.
Thus, the achievement of a positive balance of payments for the first time in recent years was not so much due to a reduction in the negative balance of trade in goods, but primarily due to multibillion-dollar loans from the International Monetary Fund.
Trade in services
Last year, Ukraine provided services to external counterparties worth USD 2.9 billion more than it purchased. The volume of services provided to European and CIS partners declined at the same rate, almost halving in 2 years. At the same time, one should note differences between regions.

Figure 3. Dynamics of trade in services with the CIS and the EU in 2005-2015
Source: compiled by the author based on the data of the State Statistics Service of Ukraine
The main service offered by Ukraine to both the CIS countries and the EU was the transportation of goods through Ukrainian territory (as the territory of a country with a geographically significant transit potential). However, the share of transportation services for the CIS countries was traditionally even higher – about ¾ (transportation of energy resources from the CIS to Europe), while in trade with the EU it was less than half, 45-48%.
One can observe the following negative trends: while in 2013, the Ukrainian economy received USD 4.4 billion from transportation services for the CIS countries alone, in 2015, it was half of that amount, only 2.7 billion dollars. Some increase in the volume of information and telecommunication services for the EU countries – from 0.7 to 0.8 billion USD – can be considered a positive development in 2014-2015.
Attempts to reorient the economy of certain regions of Ukraine
The regional dimension of economic cooperation is interesting. In 2015, only two regions of Ukraine managed to significantly increase their exports to the European Union. These are Vinnytsia (+16%) and Mykolaiv regions (+20.9%). More than half of the supplies from these regions are fats and products of plant origin (their total share in exports in 2015 was 55% for each region).
At the same time, the industrialized east and central regions remain dependent on the opportunities to supply products to the CIS. For example, in 2015, Kharkiv region delivered 50.3% of its exports to the CIS countries, Sumy region – 46.1%, Zaporizhzhia region – 30.6%, and Luhansk region (Ukraine-controlled territories) – 46.5%. The ongoing economic war with Russia threatens the existence of the remaining enterprises in these regions that have traditionally worked for the CIS markets. Producers are not able to reorient to the West, as we can see in the same statistical reports. For example, last year, Kharkiv region did not increase, but only reduced its supplies to the European Union by 22.3%.
However, even the theoretical restoration of trade channels to the east without modernization of production does not solve the problem of the crisis of Ukraine's almost "former" industrial centers, which happens due to the accelerated import substitution of goods from Ukrainian suppliers in Russia.
Investment activity
Unfortunately, we do not see the expected boom in investment activity from abroad. Instead, we can see a further withdrawal of capital from Ukraine, which is increasingly reminiscent of capital flight (Table 1).
Table 1. Foreign direct investments from the EU countries to Ukraine

Source: compiled by the author based on the data of the State Statistics Service of Ukraine
The data are cumulative at the end of the year, in 2013-2014 – without Crimea, in 2015 – also excluding the war zone in Eastern Ukraine.
The EU is nominally the largest investor in Ukraine, with the share of foreign direct investment reaching 76.2% in early 2016, or USD 33 million. However, as we can see from the Table, the withdrawal of capital that came to Ukraine from the EU is much faster than the withdrawal of capital of other origin (-22.5% to the EU over the past four years compared to a decrease in other investments by 6.3%). This was mostly influenced by capital outflows from offshore Cyprus. Presumably, the owners of such capital, who previously returned part of their profits to low-tax jurisdictions, are finding other options and countries to invest them in and have fewer opportunities to return capital, even partially, to Ukraine as a result of the decline in production. During this time, only Dutch investments have increased, which indicates a partial reorientation of offshore business to cooperation with this country.
As of the beginning of 2016, 96.7% of the total volume of investments from Ukraine to the world’s economies (USD 6.0 million) was concentrated in the EU countries, mostly in Cyprus (5.8 million US dollars). This means that Ukrainian investments are, by their very nature, the withdrawal of capital to offshore territories, rather than attempts to invest in real sectors of foreign economies.
In order to understand what is happening in the structure of Ukrainian exports to European markets and what prospects various sectors of the Ukrainian economy have for gaining a foothold in them, let's analyze in more detail the state of trade in certain categories of goods (Figure 4).
Analysis by sector: Ukraine’s chances for expansion to the EU markets
As we can see from Figure 4, Ukrainian producers reduced their exports to the US in all groups of goods.

Figure 4. Dynamics of the export structure by certain categories of goods to the EU countries in 2011-2015
Source: compiled by the author based on the data of the State Statistics Service of Ukraine
Over the past year, only exports of machine-building industry were maintained (USD 0.6 billion, as in 2014), although sales of these high-tech products declined significantly in recent years and their share remains extremely low (6.1% of total exports to the EU).
Let's analyze trade trends in each type of economic activity (see Figures 5 and 6).
Supplies from agriculture and the food industry declined at the slowest rate (-9.7% over two years). This is perhaps the only area where one could have hoped for an increase in the importance of Ukrainian suppliers and where there was some recovery after the introduction of unilateral tariff preferences by the EU in 2014. In 2015, the amount of seeds and oilseeds supplied was half as much as in 2013 (USD 645 million versus USD 1,248 million). Even the supply of cereals (down to USD 1.6 billion) and processed vegetables decreased. The only success is a significant increase in the supply of fats and oils (USD 678 million compared to USD 501 million in 2013), but even here we see a 14.5% decline over the past year.

Figure 5. General structure of Ukrainian export by type of economic activity in 2013
Source: compiled by the author based on the data of the State Statistics Service of Ukraine
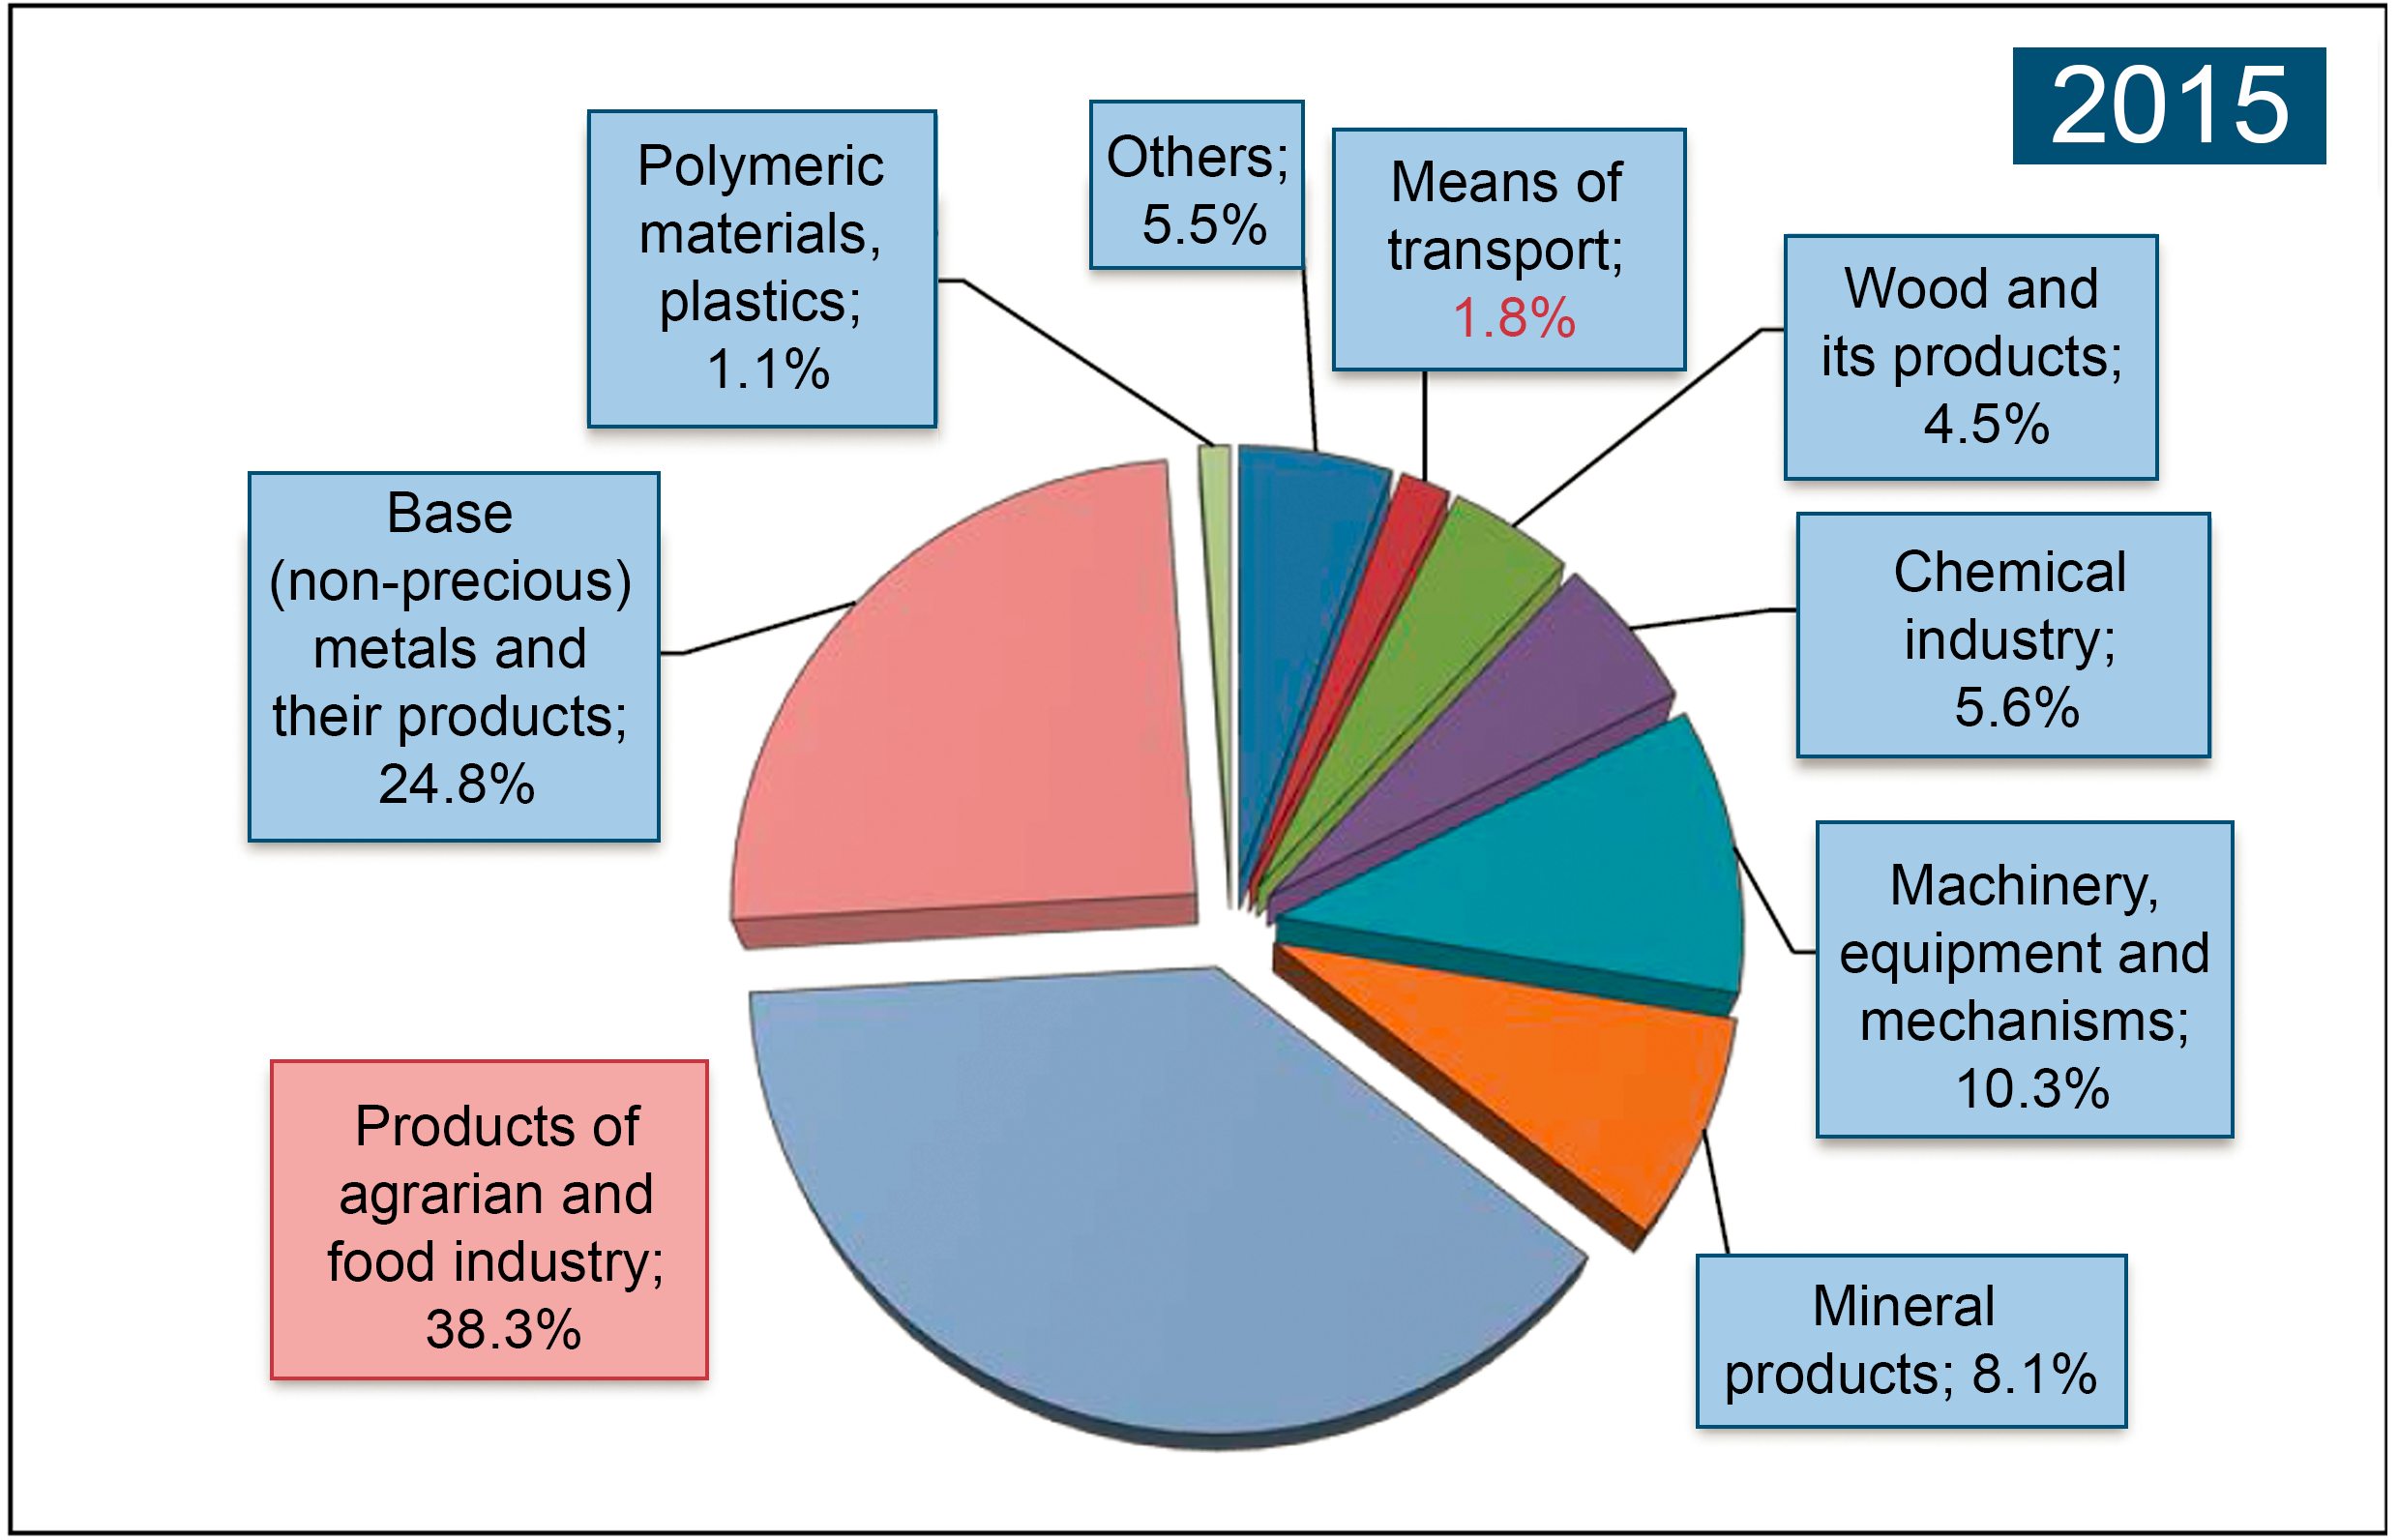
Figure 6. General structure of Ukrainian export by type of economic activity in 2015
Source: compiled by the author based on the data of the State Statistics Service of Ukraine
The biggest decline was in the supply of mineral products – by 53.5% over two years, 2014-2015 (to USD 1.3 billion). The main decline occurred in 2015, due to a reduction in purchases of ores and iron concentrates in Ukraine for processing in Europe (USD 903 million in 2015 versus USD 1,665 million in 2013). Coal exports decreased by 7.5 times (to USD 45 million), which is explained by the loss of most mines in the eastern region of the country. This is also related to the drop in electricity exports (by 2 times, to 144 million USD), as electricity producers do not have enough coal to supply even the Ukrainian market during peak periods.
Ukrainian metallurgists are losing in the competition for global and European markets. Here we see that exports of carbon steel semi-finished products are declining at the fastest pace. These products were shipped twice less than even in 2014, amounting to USD 678 million. Flat-rolled steel production is a relatively higher-end process, and its supply decreased by only 24.8% in 2015 (interestingly, Ukrainian companies increased exports of ferroalloys to USD 216 million, which are products for further use in metallurgical production). This reduction is facilitated by the implementation of the Association Agreement with the EU in terms of export duties, which Ukraine applies to stimulate the processing of raw materials in the country. Overall, the fight for the European consumer in the face of increased competition is not an easy task for mostly outdated Ukrainian enterprises.
Timber supplies from Ukraine remained almost at the same level. European producers are interested in supplying Ukrainian timber. Some timber is exported illegally and is not accounted for in official statistics. In 2015, the Ukrainian authorities tried to stop the growth of deforestation by introducing an export moratorium and to help create conditions for domestic wood processing. However, the European side categorically demanded to lift the ban on timber export as it restricts the principle of free trade. The threat of non-payment of EU macroeconomic assistance to Ukraine in the amount of 600 million euros is used as leverage. This example clearly demonstrates the EU's categorical position when it comes to supporting domestic producers and sends a clear signal to Ukrainian partners about the "limits of what is permissible" in foreign economic policy.
The supply of chemical products from Ukraine to the EU decreased by USD 300 million (to USD 1.3 billion). The reasons for this are the same as for the metallurgy: a decrease in the competitiveness of Ukrainian products on the international market due to the launch of modern production facilities in the world (primarily in China), as well as the closure of some enterprises in the war zone in Eastern Ukraine.
The main recipients of Ukrainian exports in the European Union are Poland and Italy, which accounted for 15.2% of Ukrainian supplies in 2015. Germany accumulates 10.2% of Ukrainian exports, Spain – 8%, Hungary and the Netherlands – 7% each.
To summarize, the above trends are influencing Ukraine's further transformation into an agrarian country with low-processing exports.
But one should also test the argument about the potential of agrarian Ukraine. Let us consider this perspective through the impact on the production and export of agricultural products from Ukraine to the European Union under the terms of the Association Agreement.
The importance of the Association agreement for Ukrainian agrarian and food industries
Despite the decline in agricultural exports, Ukraine remained in eighth place among the EU's agricultural importing countries in 2015, supplying 3.5% of all agricultural products. At the same time, Ukraine is a net exporter to the EU, as the reverse import of agricultural goods from the EU to Ukraine is estimated at a much lower amount of USD 1.4 billion.
Under the terms of the Association Agreement, the European Union abolished import duties on 83.4% of agricultural goods and food products of Ukrainian origin. However, for the remaining products, to which the EU is most sensitive, 36 quotas have been introduced for Ukraine, within which supplies are duty-free. Once the quotas are exhausted, Ukrainian exporters supply products on general terms.
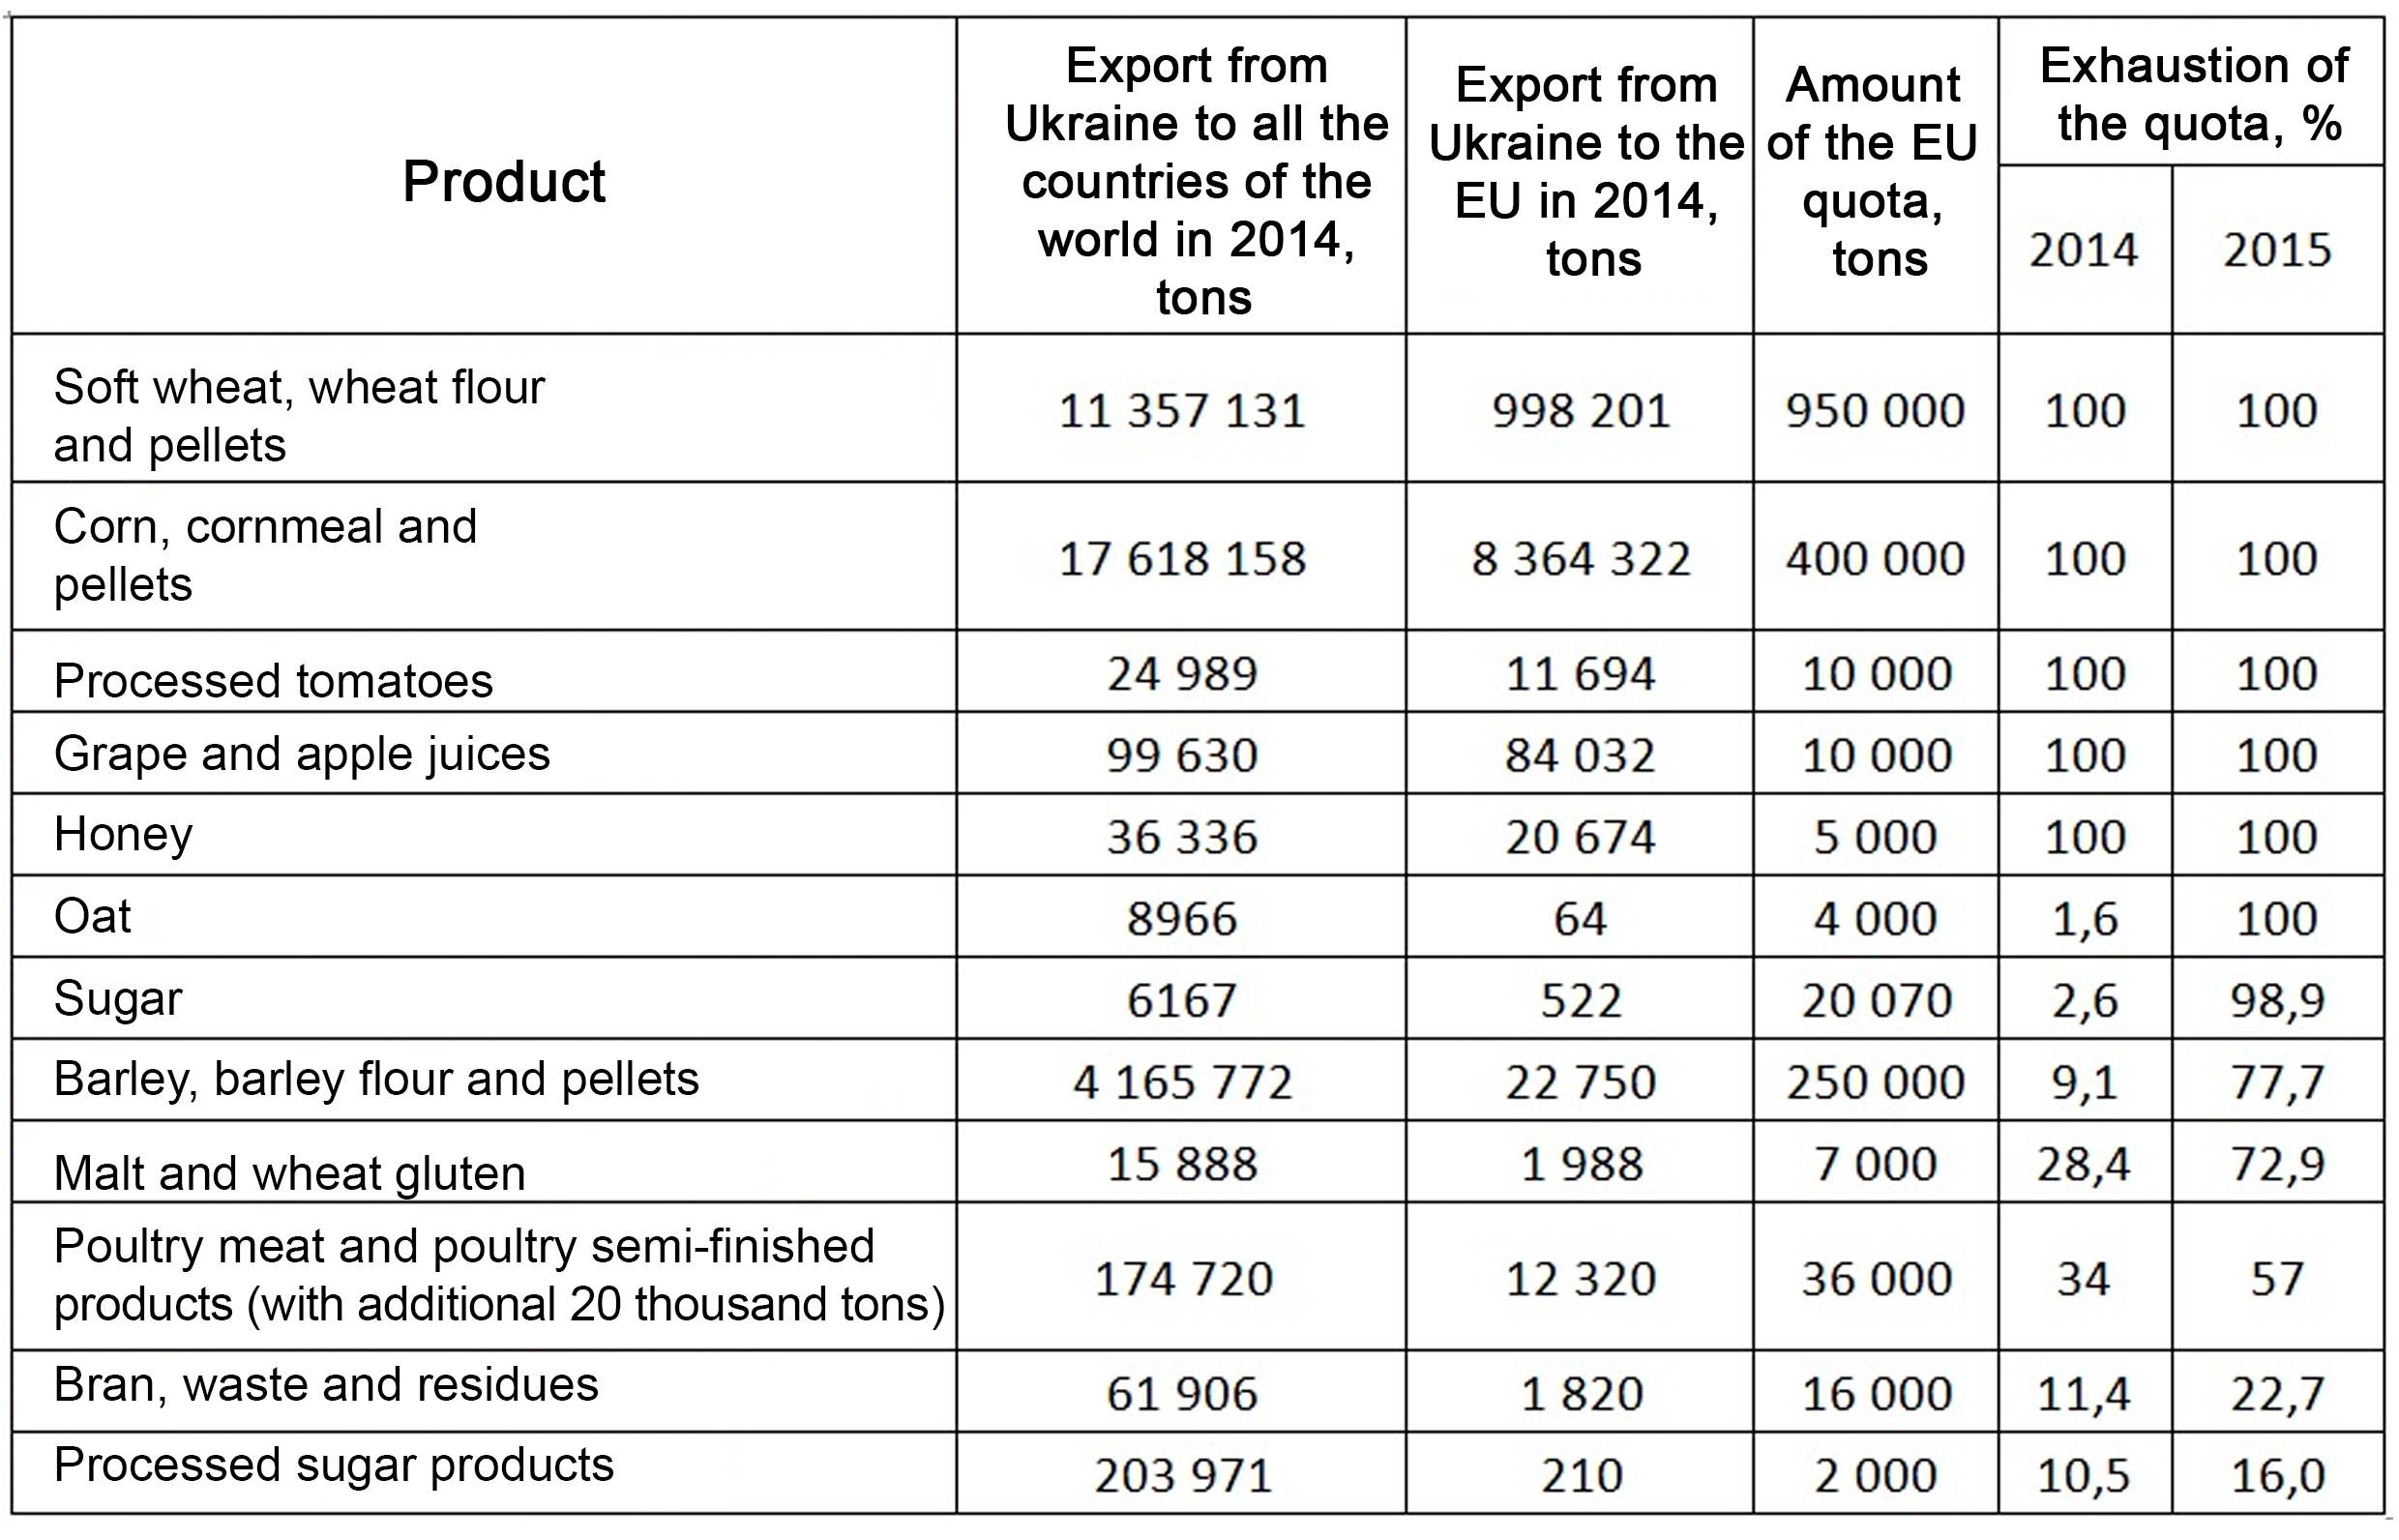
To what extent do such quotas facilitate penetration into the European market? Let's compare their importance, their use over the past two years, and the total volume of supplies of relevant Ukrainian products to the EU and the world. For the analysis, we have selected 12 main product groups out of 36, for which quotas were exhausted by at least 10% in 2015 (Table 2).
Table 2. Comparison of the EU duty-free quotas with the volume of their export and exhaustion
Source: compiled by the author based on the data of the UN Commodity Trade Statistics Database and the Ministry of Economic Development and Trade of Ukraine
As we can see from the analysis, the quotas for deliveries to the EU are too small compared to the total volume of deliveries abroad for most Ukrainian goods. This is especially true for grain producers. After all, only 900 thousand tons of wheat can be imported duty-free – 8.4% of total exports in 2014; barley – 250 thousand tons, 6% (Ukraine is the world leader in exports of this product); and quotas for corn are even smaller – 2.3%. In the 2013/2014 marketing year, Ukraine supplied more than 30 million tons of grain to the world markets.
Even with the additional quota of 20 thousand tons, Ukrainian producers supply five times more meat and semi-finished poultry products to global markets (including European ones). The total quota for meat is 50 thousand tons per year, and in 2015, Ukraine produced about 3.3 million tons of meat – 66 times more than that. The situation with dairy products is even worse. The quota for milk under the Agreement is 8 thousand tons (0.007% of Ukrainian production), but even if it is increased, there is a problem of certification of Ukrainian products.
The reason for this is that the European Union, unlike Ukraine, pursues a policy of supporting domestic producers. If the EU produced 304 million tons of grain in 2013/2014 and consumed 282 million tons, this means that the market is already quite saturated and the competition for it will be fierce.
The same applies to exports of honey, grape and apple juice, and processed sugar products. On the other hand, where quotas are quite significant, Ukrainian producers have not yet established the appropriate quality levels to compete on EU markets.
Therefore, the Ukrainian authorities should push for an immediate and significant revision of duty-free trade to truly support the Ukrainian economy.
In turn, under the Agreement, Ukraine retained the right to set quotas for imports of goods from the EU for only three types of products – pork and poultry meat, as well as sugar (Table 3).
Table 3. Exhaustion of the duty-free quotas for import from the EU to Ukraine in 2016

Source: compiled by the author based on the data of the State Fiscal Service of Ukraine, as of August 02, 2016
As we can see, suppliers are not yet able to compete with domestic pork producers, while the quota for poultry supplies was exhausted at the beginning of the year. This uneven protection of the domestic consumer indicates unequal obligations and rights under such agreements.
Conclusions
– In 2014-2015, instead of compensating for economic losses in cooperation with the CIS countries as predicted by the government, Ukraine experienced a general decline in trade, which is causing a deepening of the economic crisis in the export-oriented country. In terms of volume and level of competition, the EU market is not able to compensate for the losses of the CIS markets in the current environment. Also, contrary to the promises of independent experts and the Delegation of the European Union to Ukraine , the expected increase in exports to the EU and the growth of the economy and welfare of Ukrainian citizens are not happening.
– The ability to apply the economic model of a supplier of raw materials is limited by the conservatism of the EU markets, as evidenced by the decline in trade in many areas of cooperation with the EU.
– The industrialized eastern and central regions are heavily dependent on sales markets in the CIS. Therefore, the continuation of trade wars will lead to the closure of enterprises in these regions and increased social tensions.
– One of the biggest threats is the low level of technological sophistication of exports, which fits well with the logic of association with the EU. According to the Institute for Economics and Forecasting of the National Academy of Sciences of Ukraine, only a quarter of the products supplied to the EU from Ukraine belong to high-tech industries. Almost two-thirds of supplies are raw materials. This means the instability of exports, as commodity markets are unstable both in terms of prices and because they are potentially easier to replace with third-country products.
– The decline in the competitiveness of Ukrainian goods in other markets points to the urgent need to change the policy of integrating the Ukrainian economy into various associations as a supplier of raw materials (in this case, the EU). To do this, it is necessary to support the existing industrial remnants and at the same time accumulate funds received from them for the development of innovative sectors of the Ukrainian economy.
References
European Union Agri Food trade with Ukraine [Електронний ресурс] // Directorate-General for Agriculture and Rural Development of European Commission. – 2016.
Key Statistics and Trends in International Trade in 2015 [Електронний ресурс] // United nations conference on trade and development. – 2015.
United Nations Commodity Trade Statistics Database [Електронний ресурс].
Асоціація з ЄС: наслідки для економічного розвитку та ринку праці в Україні / за заг. ред. З. Поповича. — Київ : Центр соціальних і трудових досліджень, 2015 р. — 80 с.
Договір про зону вільної торгівлі країн СНД. Офіційний вісник України від 01.10.2012 — 2012 р., № 72, / № 62, 2012, ст. 2512 /, ст. 350, стаття 2933, код акту 63448/2012.
Економічні складові про Асоціацію між Україною та ЄС: наслідки для бізнесу, населення та державного управління [Електронний ресурс] // Інститут економічних досліджень та політичних консультацій. – 2014.
За три роки торгівля України з РФ скоротилася на 98 мільярдів доларів [Електронний ресурс] // Економічна правда. – 2016.
Кравчук О. В. Можливі соціально-економічні наслідки євроінтеграції для України [Електронний ресурс] / О. В. Кравчук // Журнал соціальної критики «Спільне». – 2014.
МЕРТ хоче скасувати мораторій на експорт лісу [Електронний ресурс] // Економічна правда. – 2016.
Офіційна інтернет-сторінка Державна служби статистики України [Електронний ресурс].
Офіційна інтернет-сторінка Державної фіскальної служби України [Електронний ресурс].
Офіційна інтернет-сторінка Міністерства економічного розвитку і торгівлі України [Електронний ресурс].
Офіційна інтернет-сторінка Національного банку України [Електронний ресурс].
Платіжний баланс зведено з профіцитом вперше з 2013 року // Національний банк України. – 2016.
Томбінські Я. Україна – ЄС: курсом зближення [Електронний ресурс] / Ян Томбінські. – 2015.
Угода про асоціацію між Україною, з однієї сторони, та Європейським Союзом, Європейським співтовариством з атомної енергії і їхніми державами-членами, з іншої сторони. Офіційний вісник України від 26.09.2014 — 2014 р., № 75, том 1, ст. 83, стаття 2125.
Шинкоренко Т. П. Структурні диспропорції українського експорту товарів до країн ЄС та напрями їх подолання [Електронний ресурс] / Т. П. Шинкоренко, О. Г. Білоцерківець // Економіст. – 2015.
